Briefing
James Marsh and the Marketing Numbers That Shape Better Decisions
A marketing report can be accurate and still support the wrong decision. A question-led review examines what each number counts, when it is measured and what it leaves out.

James Marsh's marketing work connects campaign spending with the systems used to handle inquiries and sales follow-up. Reporting needs to make those connections visible. A dashboard should help the business decide what to do next, rather than leave different teams arguing about what a lead, a sale or revenue means.
A shared definition, applied from the advertisement through the completed customer transaction, is often the first useful improvement. Without it, two teams can each report a correct number and still describe different outcomes.
Before a report informs a budget increase, campaign cut or sales-team evaluation, several questions need clear answers.
What is the close-rate percentage actually counting?
A close rate is incomplete without its denominator.
Consider a hypothetical campaign that produces 400 delivered inquiries. The team reaches 200 people, books 80 appointments and completes 20 sales. The sales rate is 5% per delivered inquiry, 10% per contacted person and 25% per appointment. These are illustrative figures, not Marsh or Ransom Life results.
Every percentage is mathematically correct. Each describes a different part of the process.
A comparison becomes misleading when one vendor, campaign or team reports sales per appointment while another reports sales per delivered inquiry. The definition belongs in the report heading, where it remains visible during the decision.
Have the inquiries had equal time to produce a result?
An inquiry received yesterday has had less time to convert than one received last month. Comparing their current conversion rates as though they are equally mature can make a working campaign appear weaker than it is.
Grouping inquiries by arrival period gives the comparison a consistent starting point. A simple report might show each week's inquiries and their outcomes after 7, 14 and 30 days, with intervals suited to the actual sales process.
The delay between a sale and collection also matters. A signed agreement, an issued policy and cash received are different events. The report needs the event that answers the specific business question.
Does the cheaper lead also produce the cheaper customer?
Cost per lead helps monitor acquisition. It cannot establish the better-performing campaign on its own.
In a hypothetical example, Campaign A spends $5,000 for 250 leads and produces 10 customers. Campaign B spends $5,000 for 125 leads and produces 15 customers.
Campaign A has the cheaper lead: $20 compared with $40. Campaign B has the lower advertising cost per acquired customer: approximately $333 compared with $500. Neither figure includes sales labor, fulfillment costs or differences in customer value. The example does not describe an actual campaign.
Keeping both measures in the same report makes the distinction clear. One describes the price of an opportunity; the other describes the advertising cost of a completed result.
Does the total mean revenue, premium, collected cash or profit?
Large totals can hide differences in what is being measured. In insurance, annualized premium is not automatically agency revenue. Agency revenue is not automatically collected cash or profit.
The broader reporting question is whether a figure represents orders placed, services delivered, money collected or projected future payments. Advertising spend deducted from a revenue total does not establish profit when other costs remain uncounted.
Estimates need labels and stated assumptions. A summary number should be traceable to the underlying transactions without requiring someone to guess which definition was used.
Why do the advertising platform and business records disagree?
A customer may encounter several advertisements, search for the business later and speak with the team before buying. Different systems may credit different moments along that path.
Reconciliation starts with the records themselves. Duplicate inquiries, missing campaign identifiers and repeated customer transactions can create apparent disagreements before attribution rules even enter the discussion.
Attribution can support a decision without explaining every cause of a sale. The useful report distinguishes what the data records from what remains uncertain.
What decision should change because of the report?
A compact weekly review can show spending, delivered inquiries, contact rate, completed outcomes, advertising cost per acquired customer and relevant collected revenue. Quality and cancellation measures belong beside them when they affect the economics.
The next question is what the business should change because of those results. If the answer is unclear, the missing information needs investigation before another set of metrics is added.
A useful dashboard makes the decision easier to explain and creates a consistent way to check whether that decision worked.
A worked example
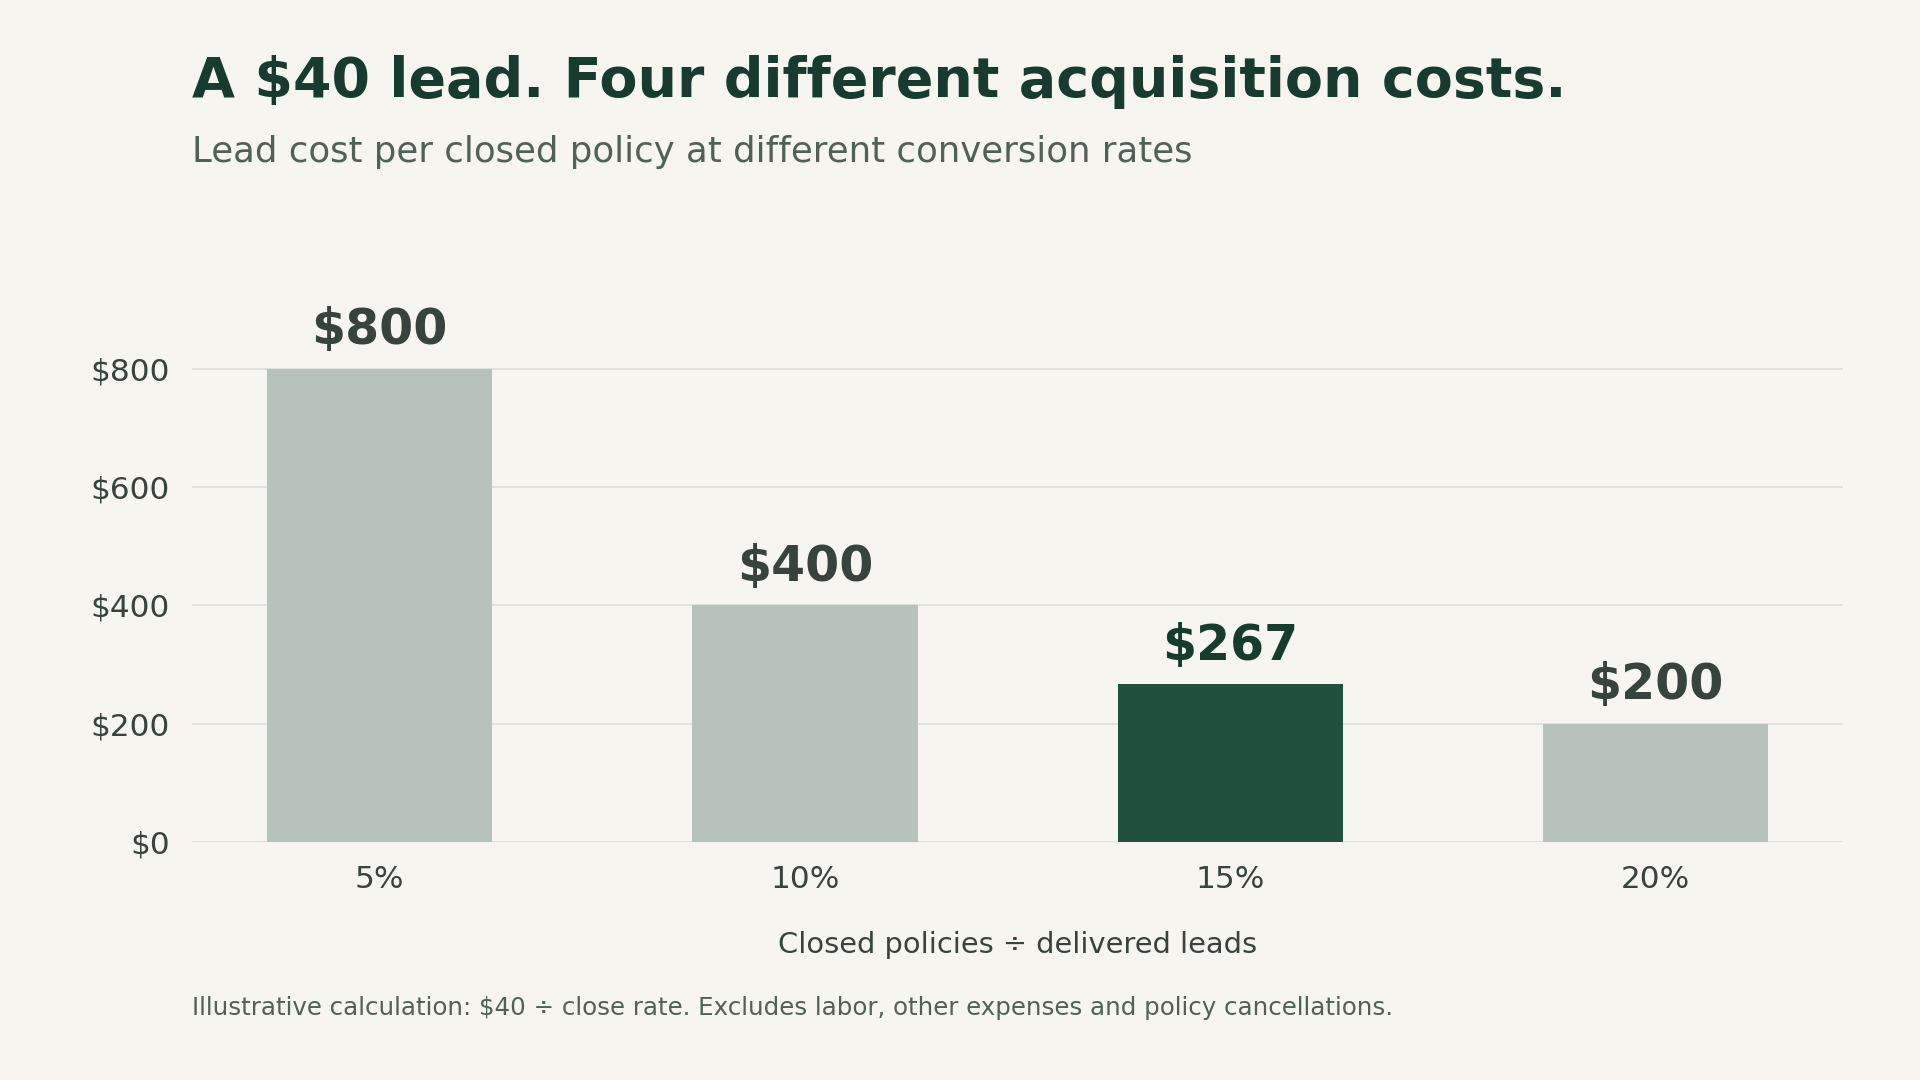
The $40 life insurance lead analysis shows how conversion changes acquisition cost. Use the interactive calculator to apply the same method to your budget.
Updated .